jmochogi
  • Welcome
  • Blog
  • Teaching
    • Teaching Statement
    • Courses Taught
  • Research
    • Publications
    • Conferences
  • CV

On this page

  • What is labelled data?
  • Labelling your data frame
  • Graphs
  • In Summary Tables

Labelled Data

Data Science
R
Labeled Data frames allow you to see the variable details in a data frame. But how do you create these labels?
Author
Affiliation

Joash Geteregechi

Ithaca College department of mathematics. Views expressed here are my own, and do not represent the college’s position.

Published

July 9, 2023

What is labelled data?

Labelled data are similar to regular data, but with the added feature of variable labels. Variable labels are descriptive names that can be assigned to each column in the data frame. This can make it easier to understand what each column represents and to communicate your results more effectively.

Having a separate documentation for checking labels can slow down your workflow.

You will need the following packages to create and use variable labels in your data frame. If you are missing any of these, you will need to install them first.

Code
library(tidyverse)      # general wrangling
library(labelled)       # for general functions to work with labelled data
library(sjlabelled)     # for example efc data set with variable labels
library(gtsummary)      # to demonstrate automatic use of variable labels in summary tables 
library(ggeasy)         # to use variable labels in ggplot

Labelling your data frame

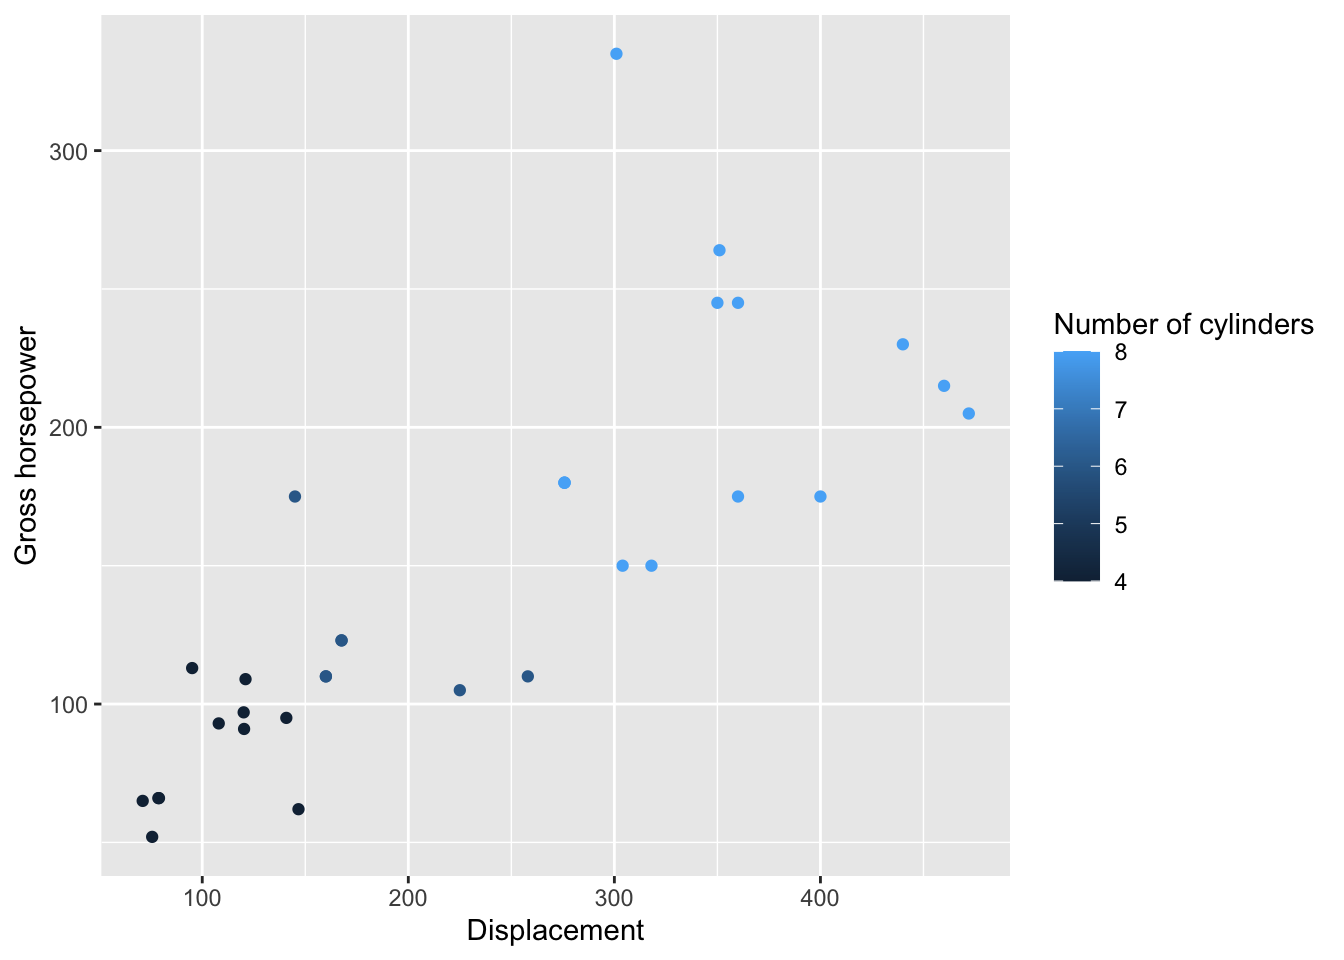
As an example, we are going to label the popular mtcars data frame that comes with R. We use the function set_variable_labels() in the following manner to achieve this goal. Notice that the labels are strings so we put them in quotes:

Code
mtcars_labelled <- mtcars %>% 
  set_variable_labels(
    mpg     = "Miles travelled per gallon",
    cyl      = "Number of cylinders",
    disp    = "Displacement",
    hp      = "Gross horsepower",
    drat    = "Rear axle ratio",
    wt      = "Weight (1000 lbs)",
    qsec    = "1/4 mile time",
    vs      = "Engine (0 = V-shaped, 1 = straight)",
    am      = "Transmission (0 = automatic, 1 = manual)",
    gear    = "Number of forward gears",
    carb    = "Number of carburetors"
  )

Note that if you mistype any of variables, the labels will not be created. You should double check to ensure that you typed everything correctly.

Run the code view(mtcars_labelled) to check whether there are any errors with your labeling.

Graphs

We can also create graphs using the labels. Here is a scatter plot of horse power against displacement. The points are colored by number of cylinders.

Code
mtcars_labelled |> 
  ggplot(aes(x = disp, y = hp, color = cyl)) +
  geom_point() +
  easy_labs()

In Summary Tables

Here is an example of a summary table using labels instead of the variables themselves:

Code
mtcars_labelled |> 
  select(gear, vs, hp) |> 
  tbl_summary(
    by = vs
  ) |> 
  bold_labels()
Characteristic 0, N = 181 1, N = 141
Number of forward gears
    3 12 (67%) 3 (21%)
    4 2 (11%) 10 (71%)
    5 4 (22%) 1 (7.1%)
Gross horsepower 180 (156, 226) 96 (66, 110)
1 n (%); Median (IQR)

Finally, you can easily generate a data dictionary to see the variables, their lables, and types. Use the code:

Code
mtcars_labelled |> 
  generate_dictionary()
 pos variable label                                    col_type missing values
 1   mpg      Miles travelled per gallon               dbl      0             
 2   cyl      Number of cylinders                      dbl      0             
 3   disp     Displacement                             dbl      0             
 4   hp       Gross horsepower                         dbl      0             
 5   drat     Rear axle ratio                          dbl      0             
 6   wt       Weight (1000 lbs)                        dbl      0             
 7   qsec     1/4 mile time                            dbl      0             
 8   vs       Engine (0 = V-shaped, 1 = straight)      dbl      0             
 9   am       Transmission (0 = automatic, 1 = manual) dbl      0             
 10  gear     Number of forward gears                  dbl      0             
 11  carb     Number of carburetors                    dbl      0             

For more information about labelling, including automatic labelling of huge data frames, check out Shannon Pileggi’s site.

Happy labeling!

Citation

BibTeX citation:
@online{geteregechi2023,
  author = {Geteregechi, Joash},
  title = {Labelled {Data}},
  date = {2023-07-09},
  url = {https://jmochogi.quarto.pub/posts/2023-07-09-Why-The-Pipe/},
  langid = {en}
}
For attribution, please cite this work as:
Geteregechi, Joash. 2023. “Labelled Data.” July 9, 2023. https://jmochogi.quarto.pub/posts/2023-07-09-Why-The-Pipe/.